In the kind of business world that is based on data nowadays, organisations produce huge amounts of information from a number of different sources. Yet the true value of data is in your ability to analyse it, to spot meaningful patterns and then turn the insights so obtained into business decisions based on sound information.
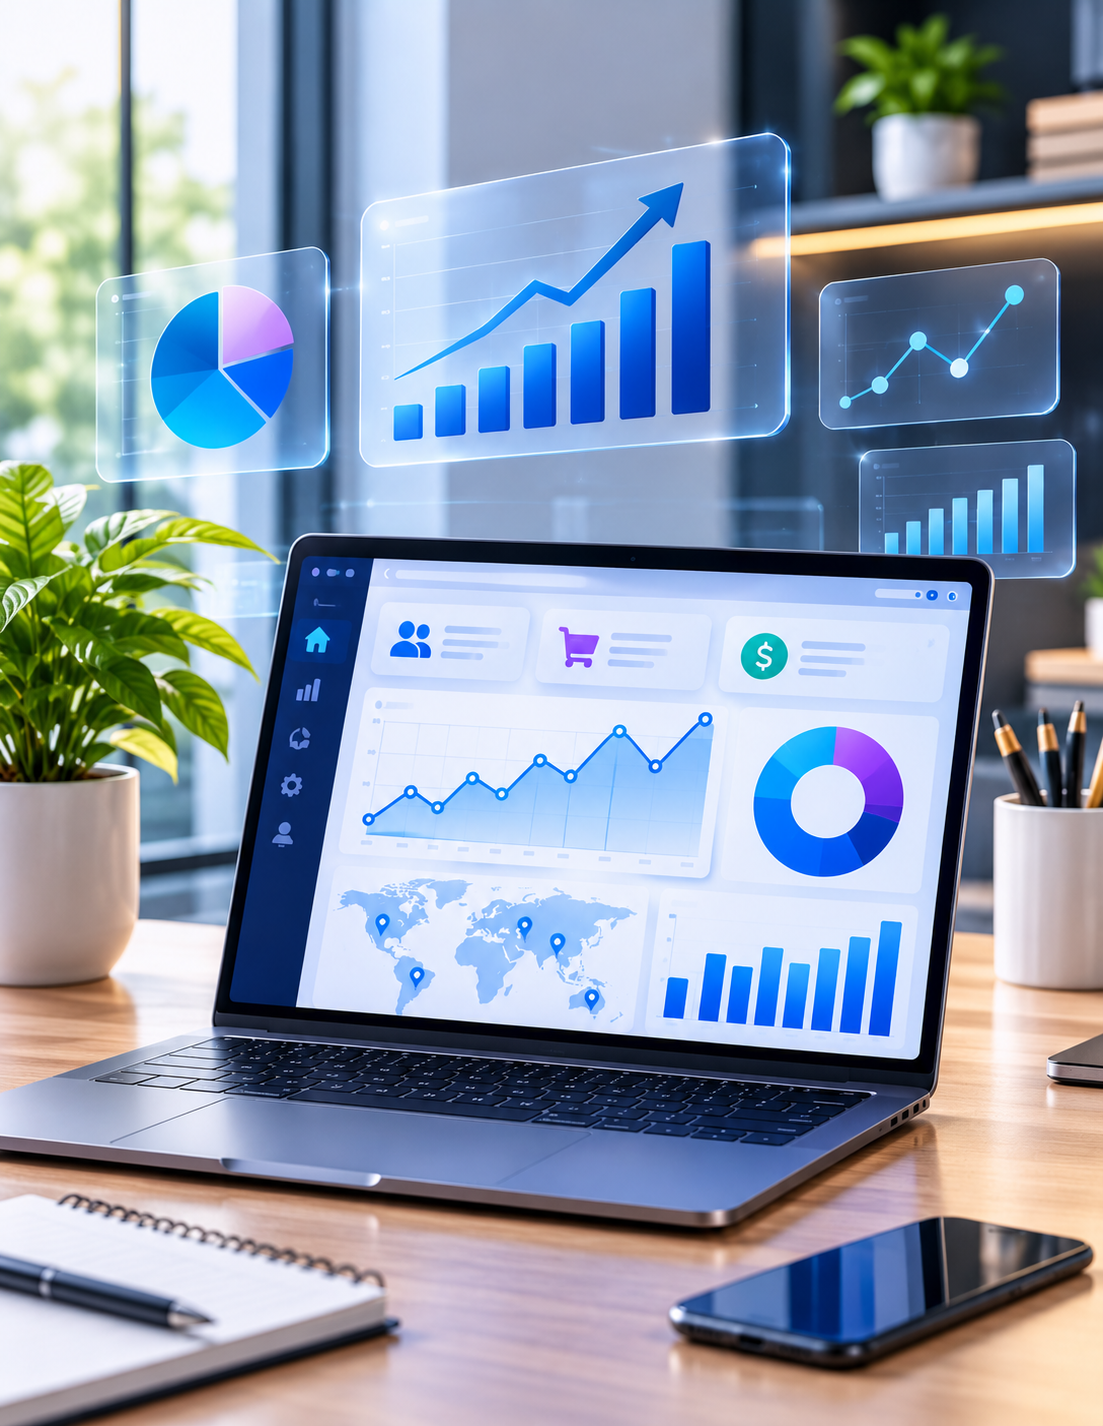
At Leadtech, we provide comprehensive Dashboards & Data Analytics solutions that help businesses and government organisations transform complex datasets into meaningful, interactive and actionable insights.
Our solutions combine data integration, business intelligence, advanced analytics and intuitive data visualisation to give decision-makers a clear view of organisational performance, operational efficiency and emerging trends.
We create tailored solutions—whether these involve real-time management dashboards and automated MIS reports or large-scale data analytics platforms—that help to simplify complex information and assist with data-driven decision-making.
Our Dashboards & Data Analytics Solutions
1. Business Intelligence (BI) Dashboards
We develop interactive Business Intelligence dashboards that provide a consolidated view of critical business metrics and organisational performance.
Our dashboards help management teams monitor KPIs, track targets, identify performance gaps and make informed strategic decisions.Our custom software development capabilities include:
Key capabilities:
- Interactive and customised management dashboards
- Real-time and periodic performance monitoring
- KPI tracking and performance scorecards
- Department-wise and region-wise analytics
- Drill-down reports and dynamic data visualisation
- Executive dashboards for senior management
2. MIS & Automated Reporting Solutions
We design tailored Management Information Systems (MIS) which automate reporting procedures and supply management with structured information.
Our solutions reduce manual reporting efforts, improve data accuracy and ensure that relevant information is available to the right stakeholders at the right time.
Key capabilities:
- Automated MIS report generation
- Daily, weekly and monthly performance reports
- Data consolidation from multiple sources
- Automated Excel and database-based reporting
- Department-wise and project-wise reporting
- Customised reporting formats and workflows
3. Data Analytics & Business Intelligence
We help organisations unlock the value of their data through advanced analytical techniques, statistical analysis and business intelligence tools.
Our data analytics solutions identify trends, patterns, correlations and performance indicators that help organisations understand their operations and discover opportunities for improvement.
Key capabilities:
- Descriptive and diagnostic analytics
- Trend and pattern identification
- Statistical analysis and data interpretation
- Predictive analytics and forecasting
- Performance and comparative analysis
- Data-driven business insights
4. Data Integration & Management
Organisations often maintain information across multiple databases, applications, spreadsheets and operational systems. We create solutions which bring this information together into a single data environment.
The way in which we integrate data guarantees consistency, accessibility and reliability for use on reporting and analytics platforms.
Key capabilities:
- Integration of multiple data sources
- Database design and management
- Data extraction, transformation and loading (ETL)
- Data cleaning, validation and standardisation
- Centralised data repositories
- API-based data integration
5. Geospatial & Location-Based Analytics
We create GIS-enabled dashboards and location intelligence solutions which enable organisations to analyse geographical information and keep an eye on activities at various locations.
They are especially useful in the fields of infrastructure management, field operations, government projects, asset monitoring and large-scale surveys.
Key capabilities:
- Interactive GIS dashboards
- Geographic data visualisation
- Location-wise performance monitoring
- GPS and geotagged data analysis
- Map-based asset and project monitoring
- Spatial data analysis and reporting
6. AI-Powered Analytics & Predictive Intelligence
We leverage Artificial Intelligence and Machine Learning technologies to take data analytics beyond traditional reporting.
We assist organisations to identify emerging trends, automate their analytical processes and produce predictive insights by using intelligent algorithms and analytical models.
Key capabilities:
- AI-powered data analysis
- Predictive modelling and forecasting
- Anomaly and outlier detection
- Automated data interpretation
- Intelligent reporting and insights
- Machine Learning-based analytical models
Technology
We use modern technologies and scalable frameworks to build secure, flexible and high-performance analytics solutions.
Programming & Backend: Python, Java, Node.js
Frontend & Visualisation: React.js, Next.js, JavaScript
Business Intelligence: Microsoft Power BI, Tableau
Databases: MySQL, PostgreSQL, Microsoft SQL Server
Data Processing: Python, Pandas, NumPy
GIS & Mapping: GIS technologies, Leaflet, Google Maps APIs
Integration: REST APIs, ETL pipelines and third-party integrations
AI & Machine Learning: Python-based ML frameworks and analytical models
Technology selection depends on the project\’s requirements, existing infrastructure and scalability needs.
Industries We Serve
Our tailored data analytics and dashboard solutions can be adjusted to meet the needs of a variety of sectors.
- Government & Public Sector: Scheme monitoring, departmental performance, project tracking and administrative dashboards.
- Infrastructure & Utilities: Asset monitoring, geographical analysis, maintenance tracking and operational performance.
- Political & Social Research: Survey analytics, constituency-level reporting, field data monitoring and election intelligence dashboards.
- Healthcare: Operational dashboards, service delivery monitoring and healthcare data analysis.
- Manufacturing & Enterprises: Production monitoring, operational efficiency, inventory and business performance analytics.
- Education: Institutional performance, student analytics and administrative reporting.
- Retail & Business: Sales performance, customer insights, regional analytics and business intelligence.
Choose Leadtech
- Customised Solutions: We develop dashboards and analytical platforms tailored to your organisation\’s specific objectives, workflows and reporting requirements.
- End-to-End Development: From data collection and integration to analytics, visualisation and deployment, we offer comprehensive technology solutions.
- Scalable Architecture: Our solutions are designed to accommodate growing data volumes, additional users and evolving business requirements.
- Actionable insights: We concentrate on transforming complex datasets into meaningful information which aids strategic and operational decision-making.
- Automated Reporting: We help reduce repetitive manual work through automated data processing, reporting and monitoring systems.
Our Approach
- Requirement Analysis: Understanding business objectives, reporting needs, data sources and key performance indicators.
- Data Assessment: Evaluating available datasets, data quality, formats and integration requirements.
- Solution Design: Designing dashboard layouts, analytical models, database architecture and user workflows.
- Development & Integration: Building dashboards, integrating data sources and developing reporting and analytics modules.
- Testing & Validation: Ensuring data accuracy, system performance, usability and reliability.
- Deployment & Support: Deploying the solution and providing ongoing technical support, enhancements and scalability.
Frequently Asked Questions
Q.1 What are Dashboards & Data Analytics solutions?
Ans. Dashboards & Data Analytics solutions convert complex data into visual reports and actionable insights, helping organisations monitor performance and make informed decisions.
Q.2 How can business intelligence dashboards help organisations?
Ans. Business intelligence dashboards help organisations track KPIs, monitor operations, analyse performance and identify areas that need improvement through real-time data visualisation.
Q.3 Can you develop customised MIS and automated reporting solutions?
Ans. Custom web applications can be developed using technologies such as Python for backend development, Next.js for modern web interfaces, MySQL for database management, and Microsoft SQL Server for enterprise data processing and reporting.
Q.4 How does AI improve data analytics and business intelligence?
Ans. AI improves data analytics through predictive modelling, trend identification, anomaly detection and automated analysis, helping organisations make better data-driven decisions.
Q.5 Can dashboards integrate GIS and real-time data?
Ans. Yes, we develop GIS-enabled dashboards that integrate GPS, geotagged and operational data to support location-based monitoring, asset tracking and project management.